FEMA Data Hub

FEMA creates, manages and utilizes numerous data and analytic tools.

We've organized our data resources by the issue they're designed to help resolve:

Guidance

Information aimed at explaining, interpreting or advising on rules, laws and procedures, such as how agencies administer regulations.

Resilience

The ability of a community or individual exposed to hazards or shocks to resist, absorb and recover from the effects in a timely and efficient manner.

Vulnerability

The inability of people, organizations and societies to withstand adverse impacts from multiple stressors to which they are exposed.

Risk

A probability or threat of damage, injury, liability, loss or other negative occurrence caused by vulnerabilities, which may be avoided through preemptive action.

Search for Indices and Tools

Baseline Resilience Indicators for Communities (BRIC)

Graphic
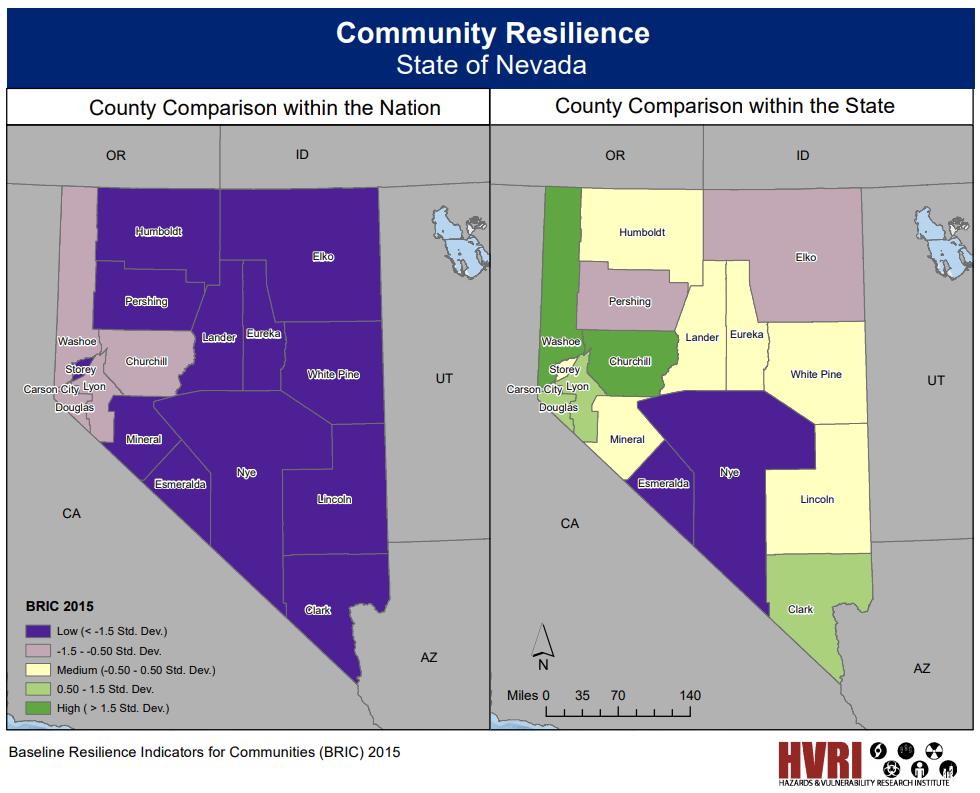
Screengrab of BRIC map

Tool Summary

  • Compare community resilience among counties and census tracts within the state and/or nation
  • Compare or track community resilience changes over time

The Baseline Resilience Indicators for Communities (BRIC) describes the differences in community resilience among counties within the state and within the nation through a comparative community resilience score. BRIC is comprised of six broad categories of community disaster resilience.

Used as an initial baseline for monitoring existing attributes of resilience to natural hazards, BRIC can be used to compare places to one another, to determine the specific drivers of resilience for counties, and to monitor improvements in resilience over time.

Baseline Resilience Indicators for Communities

External Link Arrow

Resilience

CDC Social Vulnerability Index

Graphic
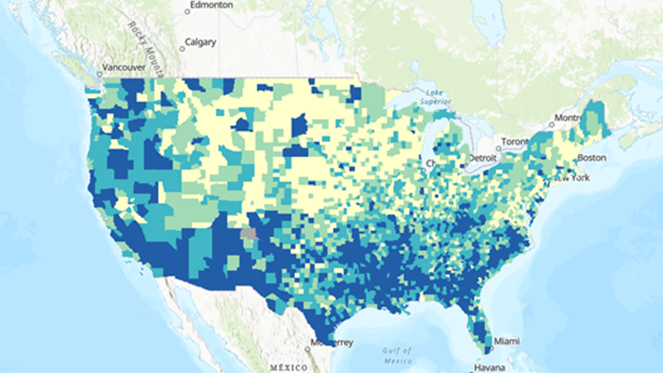
Screengrab of CDC Social Vulnerability map

Tool Summary

  • Describes areas communities are most socially vulnerable to disasters
  • Drill down into variables behind the social vulnerability scoring

This application visualizes the 2018 overall Social Vulnerability Index (SVI) for U.S. counties. The SVI uses U.S. Census data to determine the social vulnerability of every county and tract, based on 15 social factors, including poverty, lack of vehicle access, and crowded housing.

CDC Social Vulnerability Index

External Link Arrow

Vulnerability

Census Poverty Status Viewer

Graphic
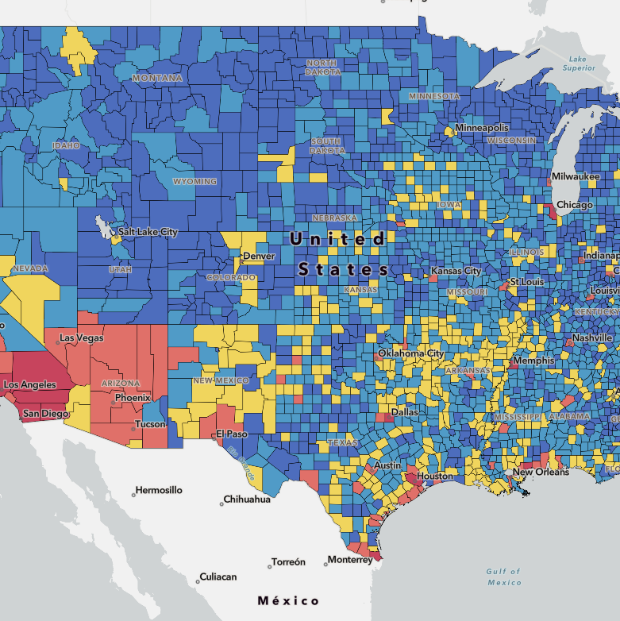
Screengrab of a Census poverty status map

Tool Summary

  • Browse the map, or search by address or census tract
  • Includes poverty data from the 2015-2019 American Community Survey

The Census Poverty Status Viewer was developed by the U.S. Census Bureau to support the Commerce Department's Economic Development Administration. The application includes poverty data for the population for whom poverty status is determined from the 2015-2019 American Community Survey 5-year estimates.

Census Poverty Status Viewer

External Link Arrow

Vulnerability

FEMA Hazus Program

Graphic
Screengrab of Hazus webpage

Tool Summary

  • Models potential losses from earthquakes, floods and hurricanes
  • Uses GIS technology to estimate physical, economic and social impacts of disasters

This application provides standardized tools and data for estimating risk from earthquakes, floods, tsunamis, and hurricanes. Hazus software is distributed as a GIS-based desktop application with a growing collection of simplified open-source tools. Risk assessment resources from the Hazus program are always freely available and transparently developed.

FEMA Hazus Program

External Link Arrow

Risk

Geospatial Resource Center

Graphic
Screengrab of Geospatial Resource Center map

Tool Summary

  • Access secure disaster response data, maps and applications
  • For eight different disaster types, find current advisories, local resources, data and imagery, historic resources, data catalog, coordination calls, and more

Before, during and after disasters, decision-makers at the federal, state, and local level need access to data. FEMA created this site to enable users to share, and access disaster response data, maps and applications in a secure environment. Our goal is to make content provided by us and our governmental, private sector and volunteer agency partners, including HHS, Census, NASA, and many others, easy to retrieve, and visible to everyone.

The site includes pages for seven different disaster types, and one for less common events. It also includes data and applications, such as aerial or other remotely sensed imagery, from historic events. Category galleries provide the ability to sort the content so you can easily find the information you need.

Geospatial Resource Center

External Link Arrow

Vulnerability

Guidance on Risk, Resilience, and Vulnerability Indices

Graphic
Screengrab of arcGIS Guidance webpage

Tool Summary

  • Includes descriptions, comparisons and key links regarding which tool to use to meet your needs

National Alliance for Public Safety (NAPSG) GIS Foundation, through a partnership with the U.S. Department of Homeland Security’s Science and Technology Directorate, and with URISA's Community Resilience Task Force, studied and curated available and emerging risk, resilience, and vulnerability indices to help the emergency management community match business needs with specific indices.

The site includes descriptions, comparisons, key links and guidance regarding which indices or tool to employ to meet your needs.

Guidance on Risk, Resilience & Vulnerability Indices

External Link Arrow

Guidance

Justice40 Initiative

Graphic
Screengrab of Justice40 webpage

Tool Summary

  • Program to ensure at least 40 percent of the overall benefits from federal investments in climate and clean energy go to disadvantaged communities
  • Includes feature to create your own maps

Justice40, an initiative of the Council on Environmental Quality within the Executive Office of the President, is a whole-of-government effort. The initiative will ensure federal agencies work with states and local communities to deliver at least 40 percent of the overall benefits from federal investments in climate and clean energy to disadvantaged communities.

The Justice40 feature layer, now available on Esri's Living Atlas, can help you create maps to understand locations of disadvantaged communities according to the Justice40 initiative criteria.

Tracts have been identified as disadvantaged across eight different categories:

  • Climate change
  • Clean energy and energy efficiency
  • Clean transit
  • Affordable and sustainable housing
  • Reduction and remediation of legacy pollution
  • Critical clean water and wastewater infrastructure
  • Health burdens
  • Training and workplace development

See more information about the Feature Layer.

Vulnerability

National Risk Index (NRI)

Graphic
Map to support the National Risk Index tool

Tool Summary

  • Provides an overall risk percentage, as well as individual risk percentages, for 18 of the U.S.'s most common natural hazards
  • Interactive maps are at the county and Census tract level

The National Risk Index (NRI) is an online tool to help illustrate the nation's communities most at risk of natural hazards. It incorporates three datasets (SoVI, BRIC, and Expected Annual Loss) to determine an overall risk percentage as well as risk percentages for 18 of the USA's most common natural hazards.

National Risk Index

External Link Arrow

Risk

NOAA Climate Monitoring Catalog

Graphic
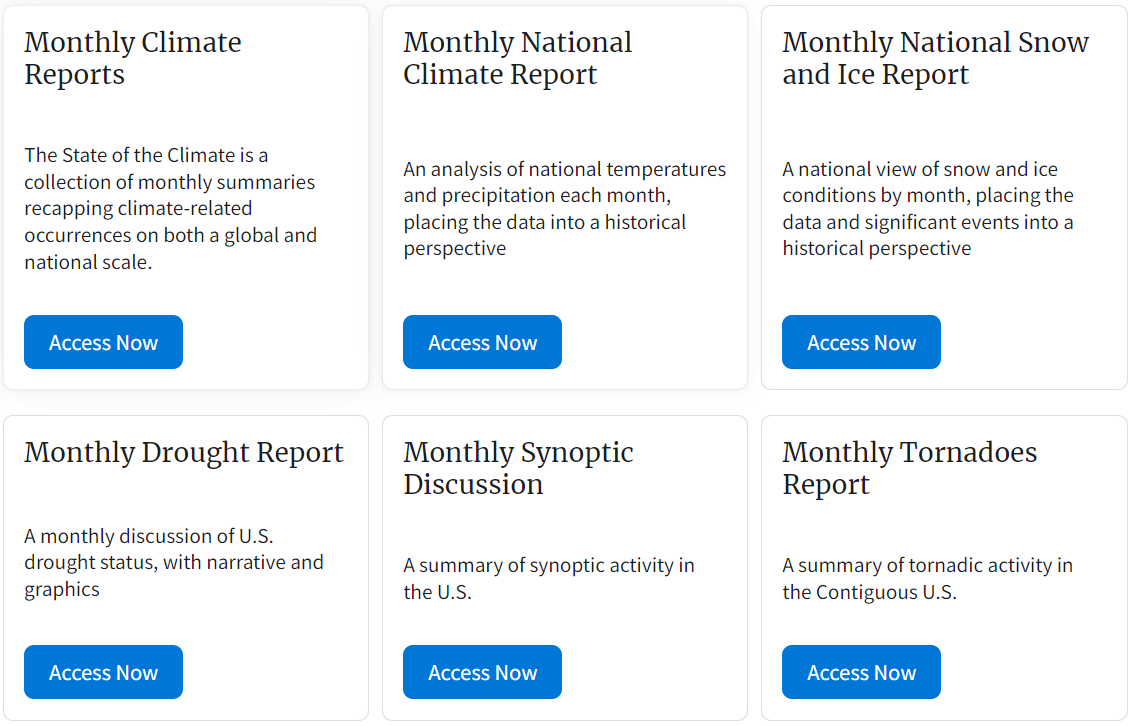
Screengrab of NOAA product catalog

Tool Summary

  • Includes monthly climate report, national temperature index, national trends and other data-focused tools
  • Provided at U.S. and global scales

A collection of summaries recapping climate-related occurrences on both a global and national scale along with other products, tools, documents, and other materials to help you navigate NCEI data and information.

NOAA Climate Monitoring Catalog

External Link Arrow

Vulnerability

Resilience Analysis and Planning Tool (RAPT)

Graphic
Screengrab of a RAPT map

Tool Summary

  • Shows connections between population, infrastructure and hazards, including real-time weather forecasts and estimated annualized frequency of hazard risk
  • Users combine data layers to create maps to inform preparedness, response and recovery strategies

The Resilience Analysis and Planning Tool (RAPT) is a free GIS web map that allows federal, state, local, tribal and territorial emergency managers and other community leaders to examine the interplay of census data, infrastructure locations, and hazards, including real-time weather forecasts, historic disasters and estimated annualized frequency of hazard risk.

View the Community Resilience Indicator Analysis (CRIA), the underlying Indicator Analysis in RAPT.  

Resilience Analysis Tool

External Link Arrow

Resilience

Last updated