Casework Highlights
Casework Spotlight
Casework Trends
The Office of the Flood Insurance Advocate (OFIA) publishes its periodic report to provide the public and industry professionals an insight into trends affecting National Flood Insurance Program (NFIP) customers and property owners.
Download a PDF of the Office of the Flood Insurance Advocate Periodic Report: January - March 2021.
Casework Highlights

The 2020 season produced a record breaking 30 named storms. However, only 15% of the OFIA’s casework in Q1 2021 directly related to any of the named storms.
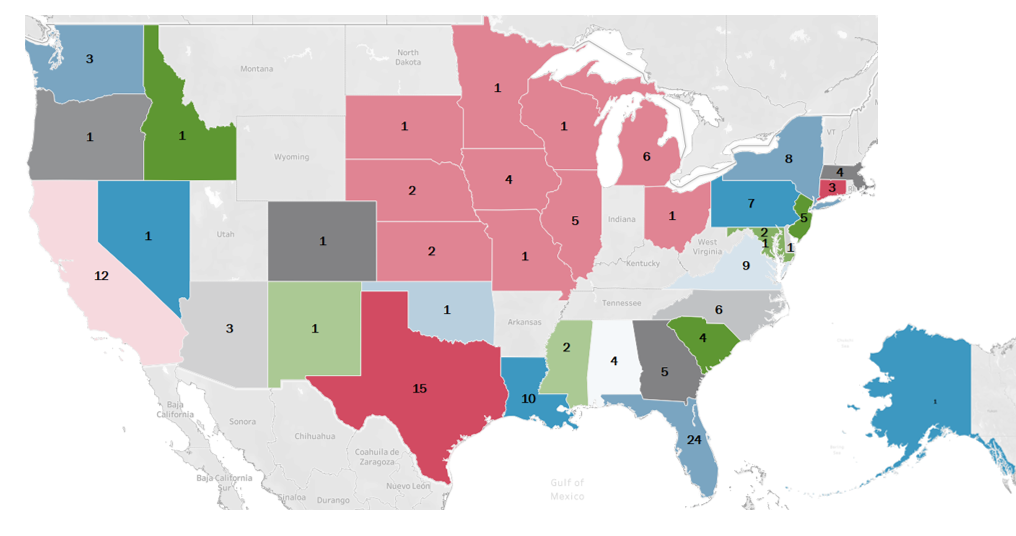
During this reporting period, the Office received a 25% casework increase from Midwest states (highlighted above in pink) compared to Q1 2020. Affordability accounted for nearly 25% of those cases.
The OFIA received a 125% increase in insurance-related casework from California in Q1 2021 compared to Q1 2020. A few cases concerned customers who experienced a lack of assistance from their agents on policy cancellations.
Casework Spotlight

Customer Issue
A NFIP policyholder in Harlingen, Texas suffered damage to two insured properties from a flood in July 2020.

Background
After eight months and repeated interactions with different adjusters to get the damage to the underlayment of the exterior stucco walls allowed, the policyholder felt he was owed money for these damages, as they were not included in the original settlement offer made.

Resolution
Working closely with the Flood Insurance Directorate’s Claims branch and with the policyholder submitting a piece of the damaged stucco wall, the insurer approved the request for an additional payment of approximately $40,000.
Casework Trends
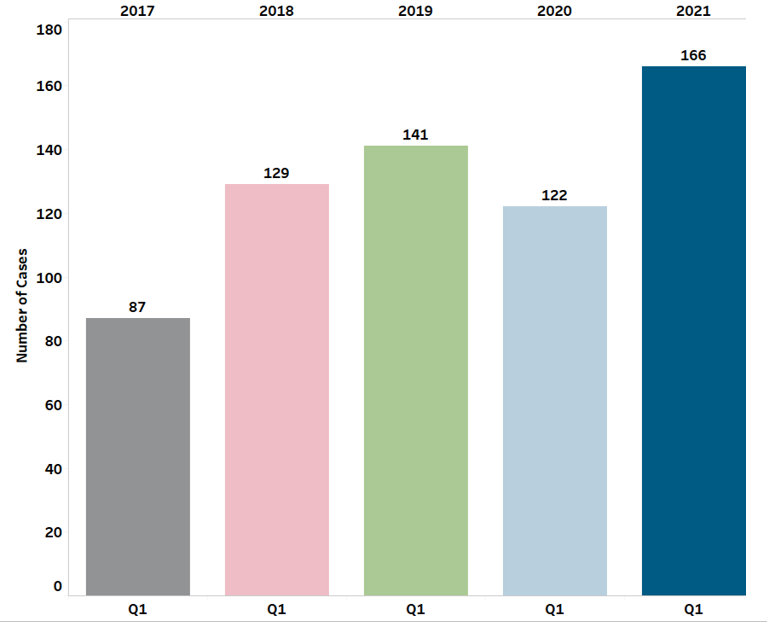
Q1 2017-2021 Casework Totals

The OFIA received 166 cases this quarter, a 36% increase from Q1 2020. This quarter’s casework is also up 18% from the prior peak year of 2019.
An increase in flood insurance and mapping related inquiries was the leading cause behind the rise in casework.
The data suggests the climb in these case topics is due to policyholder’s and property owner's inquiries on rate verification, claims coverage, cancellations, and Letter of Map Change (LOMC).
Subtopic Trends

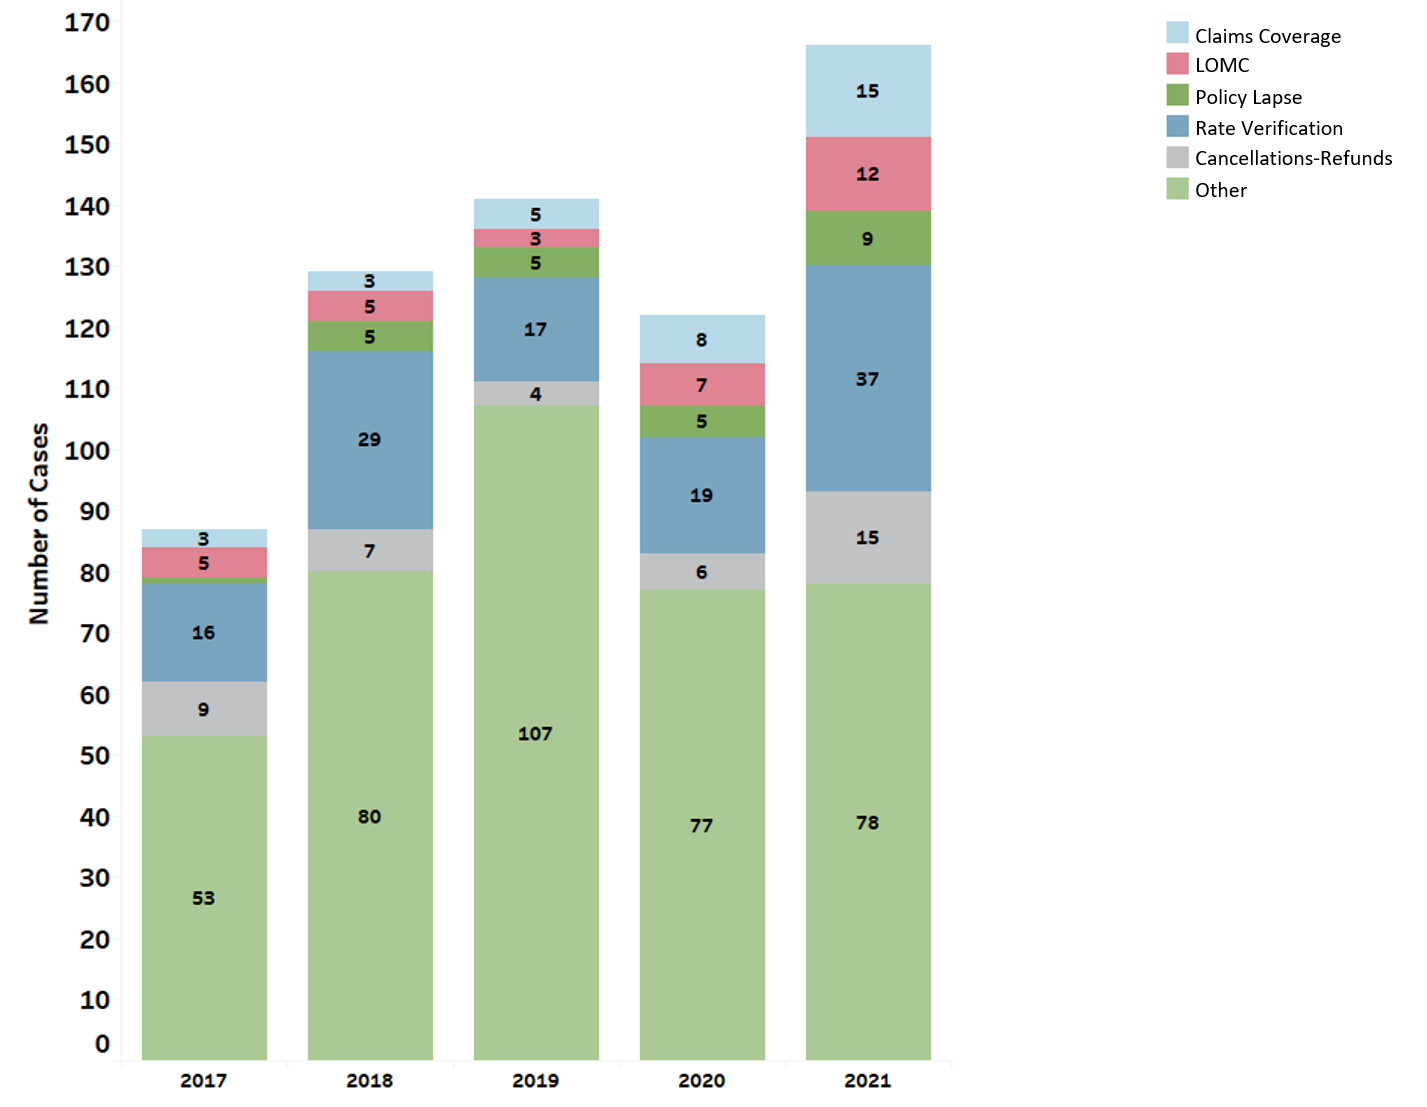
Of the 26 sub-topics the OFIA tracks, the Office received the most inquiries on rate verification (37), claims coverage (15), cancellation refunds (15), LOMC (12), and policy lapses (9).
Compared to Q1 2020, the OFIA saw a 95% increase in rate verification cases, an 88% increase in claims coverage cases, a 150% increase in cancellation refund cases, and an 80% increase in policy lapse cases during this reporting period.
The data suggests the rate verification casework increase is partly due to affordability issues. Mapping updates led some policyholders to verify their rate coverage. Others inquired about elevation certificates to lower their policy rates. Policyholders refinancing their homes to take advantage of lower interest rates also drive some casework.

OFIA Impact
Since 2015, the OFIA has advocated for NFIP policyholders with compassion and fairness. During this reporting period, the OFIA resolved 47% inquiries with a beneficial outcome for the homeowner or policyholder.
Flood Insurance Affordability Issues
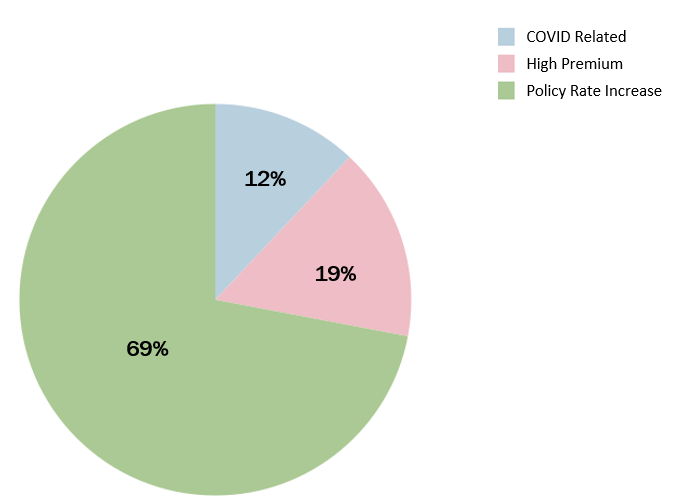
The rate verification analysis led to an examination of affordability issues across the 26 sub-topics the OFIA tracks. This examination looked at the contributing factors to affordability issues that NFIP customers faced during this reporting period.

A policy rate increase is the rise in cost from a policy’s previous renewal rate. A high premium implies a general concern for the policy’s high price, such as when purchasing a new flood insurance policy. COVID related cases pertain to the economic impacts resulting from the pandemic.
Across the three affordability issues, policyholders faced rising rates while on fixed incomes, not being able to purchase a home due to the high cost of flood insurance, and the inability to afford renewing flood insurance coverage due to the loss of a job.
The OFIA anticipates the new rating methodology under Risk Rating 2.0 will be able to alleviate some affordability issues by better incorporating the value of a home into pricing, so that those with lower values homes are not proportionately overpaying compared to those with higher value homes.

What We Heard From NFIP Customers
“The Advocate Representative was excellent in every respect. Their responses throughout were nearly immediate, they kept me informed of progress and they resolved the issue to my satisfaction.”

Need Help?
After using the available NFIP resources, if you still have questions, visit our Flood Insurance Advocate webpage and click “Ask the Advocate.”


